If you find this add-on useful, please star it on GitHub — stars show appreciation and help maintainers know their work matters.
ddev-xhgui-cli


Read XHGui PHP profiling data from the terminal. Built so that you or your AI coding agents can find slow requests, and the functions behind them, without opening a browser.
Why this exists
DDEV ships XHGui built in (v1.24.4+), but only as a web dashboard.
This add-on puts the same profiling data on stdout, where an agent can act on it. An agent working in a DDEV project can close the whole loop from the terminal:
- Generate traffic. Turn profiling on (
ddev xhgui on) and hit the app:curla URL, or drive it with a browser MCP tool for JS-heavy flows. - Query the profiles.
ddev xhgui-query runsfinds the slow requests;ddev xhgui-query top-functionsshows which functions made one slow;ddev xhgui-query callersshows who calls a hot function when its name alone isn’t greppable. - Fix it in the code. Grep the hot function names in the project source, read the implicated code, propose a change.
Installation
ddev add-on get joshuapease/ddev-xhgui-cli
ddev restart
Requirements:
- DDEV >= 1.24.4 (when XHGui landed in DDEV core)
- MySQL or MariaDB (the DDEV default). PostgreSQL is not supported.
- PHP 7.1+ in the web container. The tool runs on the project’s own PHP version.
Quick start
# 1. Turn profiling on, then visit a page so a run gets recorded.
ddev xhgui on
curl -s https://myproject.ddev.site/ >/dev/null

# 2. List recent runs (slowest first here). Prints a table in a terminal.
ddev xhgui-query runs --sort wt

# 3. Break down the most recent run into per-function time.
ddev xhgui-query top-functions
runs prints a table of recent requests with wall time, CPU, and peak memory. top-functions prints the functions that spent the most exclusive wall time in one run.
Profiles only capture requests made after ddev xhgui on, so visit the page you care about once profiling is on. ddev restart turns profiling back off; re-run ddev xhgui on to resume. Already-collected runs stay in the database.
If
ddev xhgui onisn’t available or profiling never turns on, set the mode once and restart:ddev config global --xhprof-mode=xhgui && ddev restart. See the DDEV XHProf profiling docs.
The agent loop, end to end
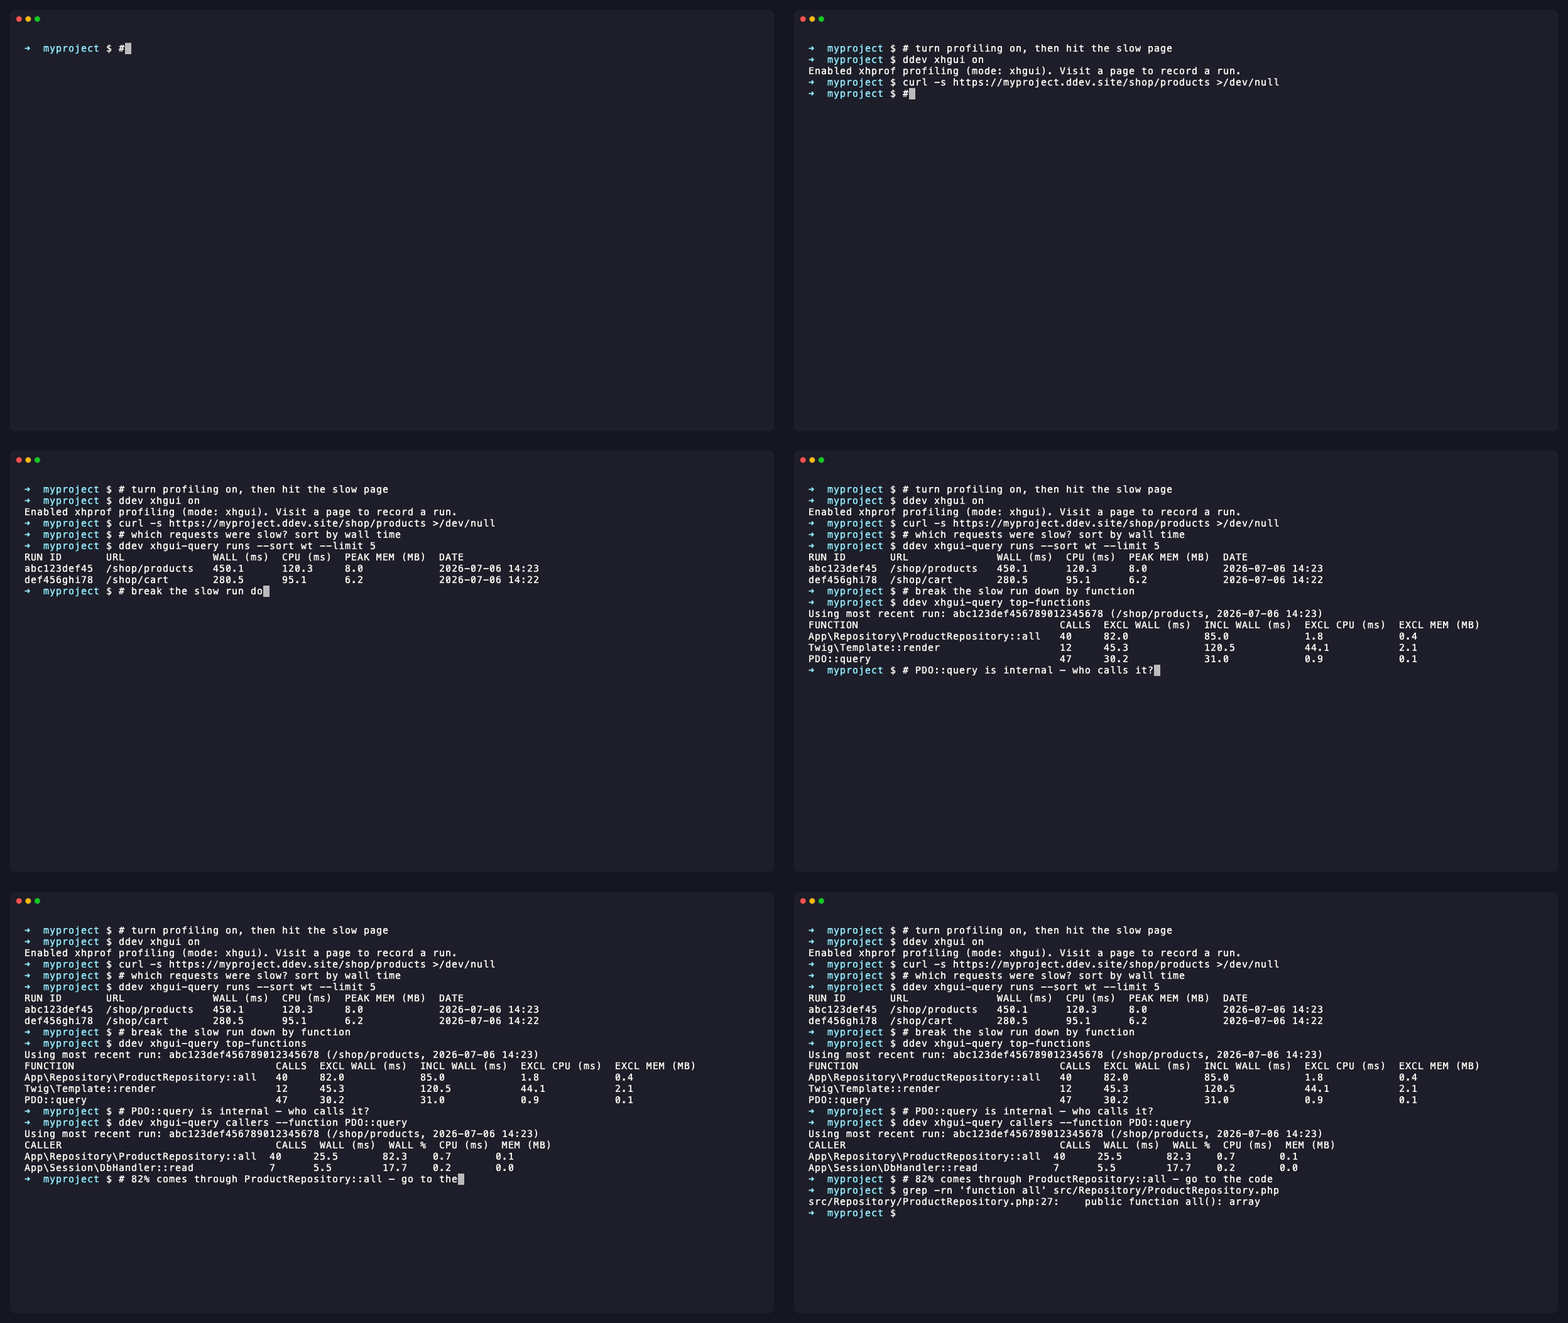
A worked run against a slow page. Comments explain what an agent does at each step.
$ ddev xhgui on

# Hit the page you want to profile. curl from the host works;
# use a browser MCP tool instead if the slow path needs JavaScript.
$ curl -s https://myproject.ddev.site/shop/products >/dev/null

# Which requests were slow? Sort by wall time.
$ ddev xhgui-query runs --sort wt --limit 5
RUN ID       URL              WALL (ms)  CPU (ms)  PEAK MEM (MB)  DATE
abc123def45  /shop/products   450.1      120.3     8.0            2026-07-06 14:23
def456ghi78  /shop/cart       280.5      95.1      6.2            2026-07-06 14:22

# Break the slow one down. With no --run-id it uses the most recent run.
$ ddev xhgui-query top-functions --run-id abc123def456789012345678
FUNCTION                                CALLS  EXCL WALL (ms)  INCL WALL (ms)  EXCL CPU (ms)  EXCL MEM (MB)
App\Repository\ProductRepository::all   40     82.0            85.0            1.8            0.4
Twig\Template::render                   12     45.3            120.5           44.1           2.1
PDO::query                              47     30.2            31.0            0.9            0.1

# PDO::query is internal — there is no source file to open. Ask who calls it.
$ ddev xhgui-query callers --function PDO::query
CALLER                                  CALLS  WALL (ms)  WALL %  CPU (ms)  MEM (MB)
App\Repository\ProductRepository::all  40     25.5       82.3    0.7       0.1
App\Session\DbHandler::read            7      5.5        17.7    0.2       0.0

# 82% of PDO::query time comes through ProductRepository::all. Go to the source.
$ grep -rn "function all" src/Repository/ProductRepository.php
27:    public function all(): array
From here the agent reads ProductRepository::all(), sees it runs one query per product inside a loop, and proposes batching the load into a single query. The profiler pointed at the function; the fix happens in the codebase.
Some names have no source to open. Internal functions like PDO::query or preg_match, and closures reported as {closure}, are not in your project. That’s what callers is for: it splits the internal function’s cost across the userland functions that call it, so the trail leads back to code you can edit.
Teach your agent this workflow
Drop this into your project’s CLAUDE.md or AGENTS.md so an agent knows the commands exist:
## Profiling with xhgui-query (ddev-xhgui-cli add-on)

To investigate PHP performance:

1. Enable profiling: `ddev xhgui on`. `ddev restart` turns it back off.
2. Visit the slow page(s) AFTER enabling — only new requests get profiled.
3. List runs slowest-first: `ddev xhgui-query runs --sort wt`
4. Break one down: `ddev xhgui-query top-functions --run-id <id>`
5. If a hot function is internal (PDO::query, preg_match, {closure}), find the
   userland code responsible: `ddev xhgui-query callers --function <name>`
6. Grep the hot function names in the source, read them, and optimize.

Piped output is JSON (`--format json` forces it); a terminal gets a table.
Exit code: 0 ok, 1 any failure. In JSON mode stdout always parses; on failure
it is {"error":{"code":N,...}} — 1 usage, 2 infra (profiling off / DB down),
3 data (bad run id).
Command reference
Run ddev xhgui-query --help, or ddev xhgui-query <subcommand> --help, for inline usage. ddev xhgui-query --version prints the tool version. Flags accept --flag value or --flag=value; unknown flags and missing values are usage errors (exit 1).
runs
List recent profiling runs. Reads only the summary columns, never the profile blob.
ddev xhgui-query runs [--limit 20] [--url /path] [--sort time|wt|cpu|pmu] [--format table|json]
| Flag | Default | Description |
|---|---|---|
--limit |
20 | Number of runs (1–1000) |
--url |
(none) | Filter to runs whose URL contains this substring |
--sort |
time |
Sort by: time, wt (wall time), cpu, pmu (peak memory) |
--format |
auto | table in a terminal, json when piped |
Table output:
RUN ID       URL              WALL (ms)  CPU (ms)  PEAK MEM (MB)  DATE
abc123def45  /shop/products   450.1      120.3     8.0            2026-07-06 14:23
def456ghi78  /shop/cart       280.5      95.1      6.2            2026-07-06 14:22
The RUN ID column is truncated for display. Use --format json to get the full 24-character id.
JSON output:
[
  {
    "id": "abc123def456789012345678",
    "url": "/shop/products",
    "wall_time_us": 450139,
    "cpu_time_us": 120300,
    "peak_memory_bytes": 8388608,
    "timestamp": "2026-07-06T14:23:00Z"
  }
]
top-functions
Show the function-level exclusive-time breakdown for one run. Decodes exactly one profile blob.
ddev xhgui-query top-functions [--run-id ID] [--limit 10] [--sort wt|cpu|pmu] [--format table|json]
| Flag | Default | Description |
|---|---|---|
--run-id |
(latest) | Target a specific run (24 hex characters) |
--limit |
10 | Number of functions (1–1000) |
--sort |
wt |
Sort by exclusive: wt, cpu, pmu |
--format |
auto | table in a terminal, json when piped |
Table output:
FUNCTION                                CALLS  EXCL WALL (ms)  INCL WALL (ms)  EXCL CPU (ms)  EXCL MEM (MB)
App\Repository\ProductRepository::all   40     82.0            85.0            1.8            0.4
Twig\Template::render                   12     45.3            120.5           44.1           2.1
PDO::query                              47     30.2            31.0            0.9            0.1
JSON output:
{
  "run_id": "abc123def456789012345678",
  "url": "/shop/products",
  "timestamp": "2026-07-06T14:23:00Z",
  "functions": [
    {
      "function": "App\\Repository\\ProductRepository::all",
      "call_count": 40,
      "inclusive_wall_time_us": 85000,
      "exclusive_wall_time_us": 82000,
      "inclusive_cpu_time_us": 2000,
      "exclusive_cpu_time_us": 1800,
      "inclusive_peak_memory_bytes": 524288,
      "exclusive_peak_memory_bytes": 419430
    }
  ]
}
callers
Show which functions call a given function, and how much of its cost arrives through each caller. This is the drill-down for hot functions you can’t grep — internal functions (PDO::query, preg_match), closures, vendor methods. Decodes the same single profile blob as top-functions.
ddev xhgui-query callers --function <name> [--run-id ID] [--limit 10] [--sort wt|cpu|pmu] [--format table|json]
| Flag | Default | Description |
|---|---|---|
--function |
(required) | Exact function name as reported by top-functions |
--run-id |
(latest) | Target a specific run (24 hex characters) |
--limit |
10 | Number of callers (1–1000) |
--sort |
wt |
Sort callers by their edge’s: wt, cpu, pmu |
--format |
auto | table in a terminal, json when piped |
If the function does not appear anywhere in the run’s profile, that’s a data error (error.code 3) — check the exact spelling against top-functions output. A function that exists but has no callers (an entry point like main()) succeeds with an empty list.
Table output:
CALLER                                  CALLS  WALL (ms)  WALL %  CPU (ms)  MEM (MB)
App\Repository\ProductRepository::all  40     25.5       82.3    0.7       0.1
App\Session\DbHandler::read            7      5.5        17.7    0.2       0.0
JSON output:
{
  "run_id": "abc123def456789012345678",
  "url": "/shop/products",
  "timestamp": "2026-07-06T14:23:00Z",
  "function": "PDO::query",
  "total": {
    "call_count": 47,
    "wall_time_us": 31000,
    "cpu_time_us": 900,
    "peak_memory_bytes": 104857
  },
  "callers": [
    {
      "caller": "App\\Repository\\ProductRepository::all",
      "call_count": 40,
      "wall_time_us": 25500,
      "cpu_time_us": 700,
      "peak_memory_bytes": 83886,
      "wall_time_pct": 82.3,
      "cpu_time_pct": 77.8,
      "peak_memory_pct": 80.0
    }
  ]
}
total is the function’s inclusive cost across all callers — the same number top-functions reports as inclusive — and each *_pct is that caller’s edge as a share of it. XHProf reports metrics per call edge (caller → callee pair), so these are exact attributions, not estimates.
Messages on stderr
Data goes to stdout; commentary goes to stderr, so it never corrupts a JSON pipe.
- When
top-functionsorcallersruns without--run-id, it picks the newest run and notes which on stderr:Using most recent run: <id> (<url>, <date>). - When a query has no results, stdout still holds valid JSON (
[]forruns, an object with"functions": []fortop-functions,"callers": []forcallers) and stderr explains why (no runs found, or the function has no callers). - A profile blob over 20 MB prints
Warning: Large profile blob (N.N MB). This may take a moment.before decoding.
How it works
The pipeline
ddev xhgui-query is a DDEV web command. DDEV runs it inside the web container, next to the app’s own PHP.
 ┌─ host ──────────────────┐
 │  ddev xhgui-query runs   │
 └───────────┬──────────────┘
             │  DDEV runs the command inside the web container
             ▼
 ┌─ web container ─────────────────────────────────────┐
 │  commands/web/xhgui-query  (bash)                    │
 │    • detects TTY, exports XHGUI_IS_TTY=0|1           │
 │    • exec php query.php "$@"        (ExecRaw: true)  │
 │  xhgui-cli/query.php  (PHP + PDO) ───────────────────┼──┐
 └──────────────────────────────────────────────────────┘  │  mysql://db:3306
                                                            ▼
 ┌─ db container ──────────────────────────────────────┐
 │  xhgui database → results table                     │
 └──────────────────────────────────────────────────────┘
Why a web command instead of a host script:
- It reaches the database directly over DDEV’s internal network with the standard
db/dbcredentials, no port forwarding. - It uses the project’s own PHP runtime, so it matches the version the app runs on.
- The wrapper sets
ExecRaw: trueandexecs into PHP, so PHP’s exit code becomes the command’s exit code and flags like--helpreach the script untouched. TTY detection is passed as theXHGUI_IS_TTYenvironment variable rather than a flag, keeping the argument list user-facing only.
Where the data lives
DDEV’s XHGui integration stores each request as one row in the xhgui.results table:
- Summary columns the
runscommand reads:id,url,main_wt(wall time),main_cpu,main_pmu(peak memory),request_ts. Cheap to scan. - A
profileblob holding XHProf’s raw call map, keyed bycaller==>callee.runsnever touches it;top-functionsdecodes exactly one. Older data may be gzipped, which the tool detects by magic bytes and decompresses.
Exclusive time, explained
XHProf records inclusive metrics per call edge: the cost of a function plus everything it called. Exclusive time is the function’s own cost, with its children subtracted out. It answers “where is time actually spent,” which is what you want when hunting a hot function.
Take three functions, main() calling foo() calling bar(), with wall time in microseconds:
main()            wt = 1000
main()==>foo()    wt =  900
foo()==>bar()     wt =  600
Sum inclusive time per function, sum each function’s direct children, then subtract:
| function | inclusive | children | exclusive = inclusive − children |
|---|---|---|---|
main() |
1000 | 900 | 100 |
foo() |
900 | 600 | 300 |
bar() |
600 | 0 | 600 |
bar() did the real work. When one function is called by several parents, XHProf’s per-edge accounting can make the summed children exceed a parent’s own inclusive total and push exclusive time negative. The tool floors those at 0, the same convention the XHGui web UI uses.
The output contract
- Format. Table in a terminal, JSON when piped.
--format table|jsonoverrides the auto-detection either way. - Streams. stdout is data. stderr is commentary (the “using most recent run” note, empty-result messages, warnings). Reading stdout alone always gives you clean data.
- Units. JSON uses raw microseconds for time and bytes for memory, with no rounding, so it stays precise for scripts. Tables convert to milliseconds and MB, rounded to one decimal, for reading.
- Errors in JSON mode. Failures print a message to stderr and also emit a parseable envelope to stdout:
{"error": {"code": N, "message": "..."}}. Stdout stays valid JSON. DDEV adds its ownFailed to run ...line on failure; it goes to stderr, never stdout. -
Exit codes and error classes.
ddev xhgui-queryexits 0 on success (including empty results) and 1 on any failure — DDEV collapses custom-command exit codes, so the shell can’t see more than pass/fail. To tell failure classes apart, readerror.codefrom the JSON envelope:error.codeMeaning Example 1 Usage error Unknown subcommand or flag, invalid --format/--sort, bad--limit2 Infrastructure error Database unreachable, XHGui not enabled, PostgreSQL project 3 Data error --run-idnot found, or its profile is empty or corrupt
Troubleshooting
“No profiling runs found.” Nothing has been profiled yet. Run ddev xhgui on, then visit a page so a request is recorded. Profiles only capture traffic that happens after profiling is enabled.
It worked, then stopped after a restart. ddev restart turns profiling off (already-collected runs remain queryable). Run ddev xhgui on again and re-visit the pages you want to profile.
“XHGui database not found” (error code 2). XHGui has never been enabled on this project. Run ddev xhgui on. If profiling still doesn’t start, set the mode once with ddev config global --xhprof-mode=xhgui && ddev restart.
“Unsupported database” (error code 2). This tool queries a MySQL/MariaDB xhgui database. DDEV’s XHGui integration and this add-on do not support PostgreSQL.
Table timestamps look off by a few hours. The DATE column and the “using most recent run” note use the web container’s local time, which DDEV defaults to UTC unless the project sets a timezone. JSON timestamp fields are always UTC in ISO 8601 (for example 2026-07-06T14:23:00Z).
Known limitations
- MySQL/MariaDB only. No PostgreSQL.
- No aggregation across runs (no averages or percentiles). Each query looks at runs individually.
- Drill-down is callers-only.
callerslists who calls a function; there is nocalleesview of what a function calls. - JSON schemas, flag names, and envelope error codes are stable within a major version. This is pre-1.0, so they may still change before 1.0.0.
Uninstall
ddev add-on remove xhgui-cli
Contributing
The tool is a single PHP file (xhgui-cli/query.php) plus a bash wrapper (commands/web/xhgui-query). Two test suites:
# PHP unit tests — no dependencies, fast. Run all of them:
for f in tests/php/*.php; do php "$f"; done

# Integration tests — require DDEV, slow. They spin up a temporary
# project, install the add-on, generate profile data, and assert.
bats tests/test.bats
Credits
- XHGui — the profiler UI and data store this reads from.
- XHProf — the PHP profiling extension that produces the data.
- DDEV — the local development environment this extends. See its XHProf profiling docs.
License
If you find this add-on useful, please star it on GitHub — stars show appreciation and help maintainers know their work matters.